The most useful best case analysis doesn't promise that everything will go right. It shows what success could look like, which assumptions make it possible, and what you should do if those conditions begin to emerge. An optimistic outcome is not the same as a probable outcome. Treating them as interchangeable can lead you to overcommit cash, inventory, or time.
Choose a method that fits the decision, the evidence you have, and the precision you need. A simple projection can clarify an achievable upside. A scenario model can show how a strategy performs under different conditions. A decision tree can help you compare an investment with its alternatives. In every case, write down the assumptions, identify evidence that would support them, and decide what would change your plan.
For an Etsy seller, a ranking target makes the distinction concrete. A listing reaching the top 15 for an agreed search phrase within a defined period is a specific outcome to assess. It still doesn't establish how many shoppers will see the listing, click it, or buy. The methods below turn an optimistic outcome into a planning tool, not a promise about what will happen.
1. Best-Case Scenario Projection
Every best-case scenario projection should answer one question: what could you achieve if the important things go well? It estimates the most favorable realistic outcome under a defined set of favorable assumptions. In valuation work, analysts compare this case against a most likely case and a worst case, adjusting inputs like revenue growth, operating margins, and discount rates (NYU Stern's overview of probabilistic valuation). The assumptions still have to be defensible. An optimistic case built on numbers nobody believes wastes everyone's time.
An Etsy seller, for instance, might project that a seasonal listing reaches the top 15 for a relevant search phrase during its selling window, attracts qualified shoppers, and converts well. If those assumptions support a substantial increase in weekly orders, the upside justifies a stretch target. Inventory and cash commitments should still follow the base case. The best case sets ambition; the base case sets spending.

Make the projection testable
Write each assumption as a separate statement. For example: "The phrase matches buyer intent," "the listing reaches the agreed rank within the target window," and "conversion holds as traffic increases." Then name the evidence for each: observed rank, impressions, clicks, or orders. If you can't point to evidence, the assumption is a guess.
Upglider describes a focused campaign built around one Etsy listing and one agreed phrase, with a top-15 ranking objective within 9 to 21 days of confirmed payment and placement maintenance during the campaign. Its money-back guarantee applies if the agreed ranking objective isn't reached within 21 days. That threshold defines the campaign's success condition; it says nothing about sales volume. Ranking also depends on more than keyword matching: Etsy lists listing engagement, shop quality, customer service, and recency among its search signals (Etsy's search policy).
Put the projection on a calendar. Pick a review date, compare it with actual results, and revise assumptions when the evidence changes. If early signals confirm the favorable path, commit the extra stock or spend then, with evidence behind the decision.
2. Three-Point Estimation
A single estimate can hide uncertainty. Three-point estimation makes it visible by recording an optimistic estimate, a most likely estimate, and a pessimistic estimate for an uncertain task or result. Teams use this approach to plan project timelines and costs, then compare the favorable outcome with the central estimate before committing to a deadline or budget.
For example, a maker preparing a new printable collection could estimate how long the work would take if everything went smoothly, how long it would most likely take, and how long it might take if revisions or production delays arose. The point isn't to pretend that one of these estimates is certain. It's to make the range clear enough that the maker can plan around the likely case without ignoring the possibility of a faster launch or a delay.
Define “smoothly” before estimating
Ask contributors what would need to go right for their optimistic estimate to hold. Does it depend on approved artwork, available materials, or a timely review? If those conditions aren't explicit, different people may use different meanings of “best case,” and the estimates won't be comparable.
Practical rule: Put the three estimates side by side, then explain the assumptions behind each one.
Compare the optimistic estimate with the most likely estimate. A wide gap is a sign that the plan depends heavily on favorable conditions. If the gap matters to the decision, identify the uncertainties driving it and check whether you can reduce them, for example by settling design choices earlier or lining up supplies before production begins.
Re-estimate after meaningful milestones instead of treating the first estimate as fixed. If approvals arrive early, the remaining timeline may improve. If a key task slips, update the forecast and make a decision based on the new information. Three-point estimation is most useful when it changes a plan, not when it merely records a range.
3. Scenario Planning
A single-figure projection answers one question. Running a shop raises several, so scenario planning builds a set of coherent accounts of what could happen and pairs each one with a decision. Within that set, the best case is one of the futures the team has described; its job is to prepare a response. Structured scenario planning helps teams notice early-warning signals, test the strength of their capabilities, develop strategic options, and compare the risk and return of choices (NC State's scenario-planning case study).
A shop preparing for a holiday selling season might write three accounts. Its best case has one flagship listing reaching top-15 visibility for a single target phrase and holding that position through the selling window. The base case assumes visibility improves more slowly. The downside case accounts for weak shopper response or a shift in demand. For each scenario, the seller decides in advance how much stock to prepare, which promotion to continue, and what evidence would justify changing course.
Connect each future to a decision
Give each scenario a memorable label and attach observable signals to it. For an Etsy listing, useful measures include rank, impressions, clicks, favorites, carts, orders, and whether the placement holds. Rank alone is weak evidence: a position can hold while the phrase fails to attract buyers or the listing fails to convert them.
A top-15 result also needs context. Etsy search uses query matching and adjusts results based on relevance and other signals, including shopper-specific context. Etsy's Marketplace Insights gives sellers information about search demand and competition, which helps them evaluate a phrase instead of choosing one solely because it looks attainable (Etsy's guidance on search and relevance).
Document the plan. Record the time horizon, assumptions, indicators, and review triggers for each scenario so the team can act when evidence points toward a particular future. Sellers matching a ranking objective to a seasonal window can use Upglider's campaign schedule to align each scenario's horizon with real campaign dates.
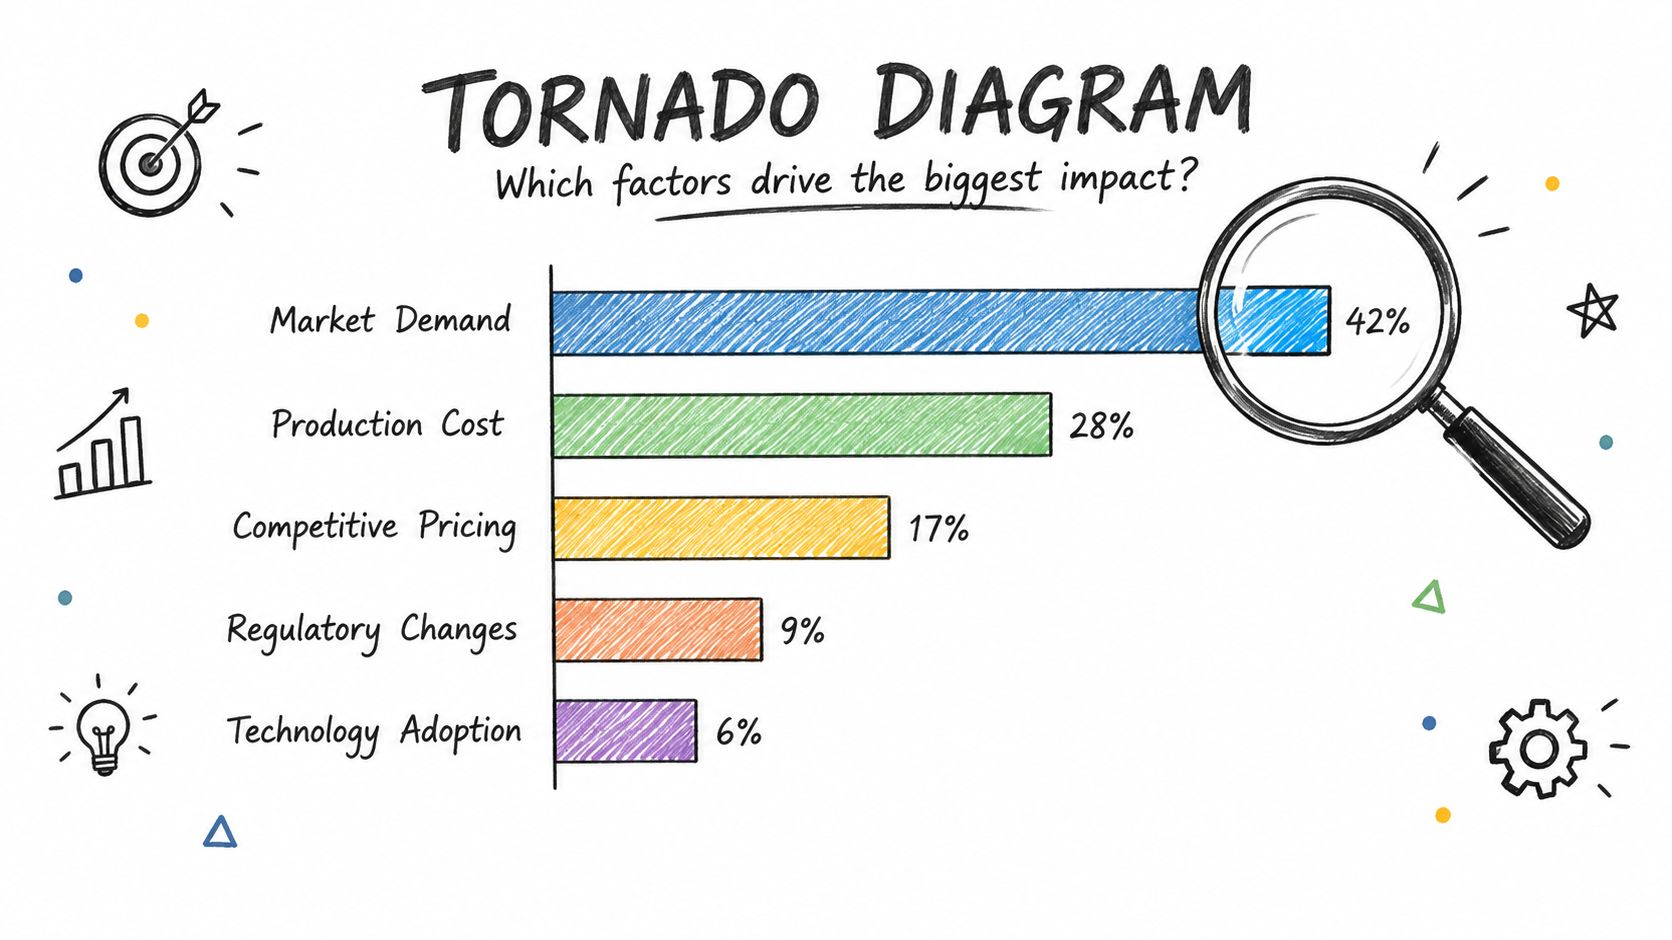
4. Sensitivity Analysis With Tornado Diagrams
A tornado diagram earns its keep after the base model exists. Sensitivity analysis takes that model, moves one input to a realistic favorable value, and measures how much profit, cash, or feasibility changes. The diagram sorts those moves into bars from largest to smallest, so the useful question becomes blunt: which assumption deserves attention first?
For an Etsy ranking campaign, model position and conversion as separate inputs. A top-15 placement within 9 to 21 days can improve the odds of being seen during a seasonal window, but the swing that matters may come from the listing persuading qualified shoppers to buy. Etsy's search policy (linked in Section 1) lists clicks, views, favorites, and purchases among engagement signals, so treat engagement as evidence to monitor rather than a guaranteed outcome.
Test one input at a time
Hold every other assumption steady while you move a single variable. If ranking speed, demand, and conversion all change together, the bar chart hides the cause. Order the results, then work down from the widest bar: first decide whether you can influence that input, then decide what evidence would justify a better assumption.
Keep favorable inputs plausible. If a top bar depends on a conversion rate your shop has never approached, mark it as a stretch case and look for proof before committing inventory or budget. Re-run the analysis when campaign data changes the picture. The payoff is focus: a short list of assumptions that control most of the upside and the monitoring triggers tied to them.
5. Monte Carlo Simulation
Monte Carlo simulation models uncertainty by repeatedly drawing values from defined ranges for several inputs, then showing the resulting spread of outcomes. It suits decisions where uncertain variables interact, such as a project forecast or a campaign model combining baseline rank, phrase difficulty, listing relevance, shopper engagement, conversion, and seasonal demand.
For an Etsy campaign, a seller could model a range of possible time-to-rank outcomes alongside potential qualified visits and orders. The output shouldn't be a single unsupported “best” number. It should show the range of results and identify which assumptions are responsible for the more favorable outcomes. Forecasting guidance also cautions against relying on one optimistic point estimate; scenario-based estimates and prediction intervals can offer different views of uncertainty (INSEAD's discussion of scenario thinking and forecasts).
Keep the model explainable
Use historical shop data where available. If you don't have a reliable basis for a particular input, use a clearly bounded range and say why you chose it. Don't assign a precise probability just to make the spreadsheet look scientific. The model is only as credible as the assumptions going into it.
A seller can use a spreadsheet or simulation tool to compare outcomes under different inputs, then set review rules. Continue when rank improves and the traffic remains relevant. Reassess when rank improves but engagement is weak. Check the contractual terms before treating a campaign as a refund case; a commercial guarantee may cover an agreed ranking threshold, not revenue or order volume.
Rank tracking helps distinguish a recorded position from downstream performance. For measurement ideas, see Upglider's guide to rank tracking. Report the assumptions and outcomes in plain language so another person can understand what the model says, and what it doesn't.
6. Bull, Base, and Bear Case Financial Modeling
A bull, base, and bear model gives financial forecasts three different sets of operating assumptions. The bull case describes the upside if favorable conditions hold. The base case represents the central planning view. The bear case shows how the decision looks under less favorable conditions. This structure is useful for budgeting, investment choices, and deciding how much cash a business can safely commit.
A small Etsy shop considering a new product line might build a bull case around a listing that performs well and a bear case in which sales remain weak. Rather than assuming an increase in revenue without evidence, the seller should connect each result to measurable drivers: relevant search demand, listing visibility, shopper response, and conversion. If the downside case would make the plan unaffordable, the seller should reduce the initial commitment or stage spending against evidence.
Protect the budget from optimism
Write down the assumption behind each financial driver. Etsy ranking depends on more than titles and tags. Etsy also identifies listing and shop quality, customer service, and recency among the signals that can affect search visibility (Etsy's search-optimization checklist). A forecast that assumes improved visibility while ignoring listing readiness or shop operations is incomplete.
A promising upside can guide a target. It shouldn't set the maximum you can afford to spend.
For a listing promotion, compare the cost with the value of the expected business outcome, not with rank alone. Separate any guaranteed service threshold from assumptions about customer demand and sales. Upglider focuses on ranking a single listing for an agreed phrase, rather than broader shop marketing or sales management. A seller comparing that service with other Etsy ranking approaches can review Upglider's explanation of Etsy rankings, then test whether the campaign fits the shop's financial plan.
7. Decision Tree Analysis
A decision tree maps a choice, the outcomes that can follow, and the evidence or probabilities behind each outcome. Its best-case branch shows the payoff under favorable conditions. That branch means little on its own: the full tree must also price the worse outcomes, the cost of each option, and any refund or guarantee that changes the downside.
A seller promoting a flagship listing could weigh a focused ranking campaign against new product photography. The campaign has a defined ranking objective; photography changes how shoppers respond once they see the listing. Draw both options out in full before comparing them. On the ranking branch, attach a separate node for the case where rank is achieved but the click-through assumption fails, and cost that branch explicitly. Do the same on the photography side if engagement improves but orders do not follow.
Compare branches, not promises
For each option, write the sequence of events that must happen. A ranking campaign depends on the phrase having useful search demand, the listing matching that phrase, and placement arriving inside the agreed window. Then decide in advance what the seller does at each failed node, not only at the successful one.
Estimate break-even probability only when the inputs have a defensible basis. If the probabilities are guesses, label them as judgments and rerun the tree with the favorable outcome made less likely. That shows whether the recommendation survives a weaker assumption or collapses with it.
Rank is also not universal visibility. Search results vary by query and context, as covered in the Scenario Planning section, so define how the rank will be measured and track downstream signals such as impressions, clicks, and orders. Choose the branch that fits the actual goal, whether that is a time-bound placement, better listing engagement, or a more resilient use of the budget.
Best-Case Analysis: 7-Method Comparison Matrix
Method | 🔄 Implementation Complexity | ⚡ Resource Requirements | 📊 Expected Outcome | Ideal Use Cases | ⭐ Key Advantage |
|---|---|---|---|---|---|
Best-Case Scenario Projection | Low; uses a few optimistic assumptions | Minimal; spreadsheet and basic data | Single favorable target, date, or revenue estimate | Quick planning for sales, traffic, budgets, or timelines | 💡 Provides a clear, motivating upper target |
Three-Point (PERT) Estimation | Low to moderate; estimates optimistic, likely, and pessimistic values | Low; team input and a simple formula | Weighted expected estimate plus a rough uncertainty range | Project time, cost, and effort estimates | ⭐ Balances optimism with likely and worst-case outcomes |
Scenario Planning | High; develops consistent narratives and response plans | Moderate to high; cross-functional input and research | Several plausible futures linked to actions and warning signs | Long-term strategy and seasonal planning | 💡 Builds flexibility and prepares teams for changing conditions |
Sensitivity Analysis with Tornado Diagrams | Moderate; varies and ranks one input at a time | Low to moderate; spreadsheet and reasonable input ranges | Ranked view of which variables most affect results | Prioritizing assumptions, data collection, or improvement efforts | ⭐ Highlights the factors with the greatest impact |
Monte Carlo Simulation (Upside Percentile) | High; requires distributions and model setup | High; software, data, and technical skills | Probability-based outcome distribution and percentiles | Complex projects or financial models with interacting uncertainties | 📊 Quantifies risk and upside while accounting for interactions |
Bull, Base, and Bear Case Financial Modeling | Moderate; builds three linked forecasts | Moderate; financial data and spreadsheet or modeling tools | Revenue, profit, cash flow, or valuation under three cases | Investment analysis, startup planning, and budgeting | ⭐ Familiar format that supports spending and financing decisions |
Decision Tree Analysis (Best-Branch Expected Value) | Moderate to high; maps choices, outcomes, and probabilities | Moderate; payoff and probability estimates | Expected value for each option, including best-case branches | Comparing discrete choices with measurable outcomes | 📊 Makes trade-offs and the value of upside easy to compare |
Turn the Best Case Into a Decision
Pick the method that matches the decision in front of you. A simple projection defines a favorable target. Three-point estimation handles an uncertain task or timeline. Scenario planning prepares responses for several plausible futures. Sensitivity analysis shows which assumptions carry the most influence, Monte Carlo simulation handles interacting inputs, financial cases protect a budget, and a decision tree compares discrete alternatives.
Whichever method you choose, write down every optimistic assumption before you spend anything. State what would have to go right, what evidence would confirm it is happening, and what would force you to revise the estimate. Put a base case next to the best case. Use the favorable outcome to set a target worth working toward, never to justify spending the business cannot sustain under average conditions.
For Etsy sellers, one discipline matters above all: keep ranking, buyer visibility, and sales as three separate outcomes in your model. Search placement depends on relevance, listing engagement, and shop quality signals, as noted earlier, so a position gain is a leading indicator rather than a revenue figure. Treat it that way in your forecast.
If you evaluate a focused ranking service, check the scope, measurement method, time window, and remedy before paying. Upglider works on one listing and one agreed search phrase per campaign, with a top-15 objective within 9 to 21 days and ongoing placement maintenance during the paid period. Campaigns last 30, 90, or 180 days, and the service includes a pre-payment case assessment plus a money-back guarantee if the agreed threshold is not reached within 21 days. Those terms define a measurable, time-bound best case. They do not promise sales.
Across all seven methods, the shared discipline is the same: the best case earns its place in your plan only when you can name the evidence that would confirm it and the action you would take if it arrives. Record your assumptions, set a review date, and decide in advance what follows if the evidence supports the upside or points away from it. If a focused Etsy ranking campaign fits that framework, review Upglider's scope and terms and judge whether a single-listing, single-phrase objective matches your shop's goals and budget.